2.1.2. Motadata Health
It provides instant summary of Motadata Health Status. Click on Motadata Health icon and see detailed information. Information will be displayed along with below tabs:
Prerequisite: Motadata system password should be set in Admin > Global Settings > Motadata System Password.

Motadata Health Option
Motadata Health Screen
Motadata The motadata tab shows health status of Motadata server under different filters. If you have RPE installed, you’ll see a similar tab of RPE health. To see the history of any information, click on any value and system will show you it’s graph with historical records. You can use the date range to see information of a particular duration. The filters under which Motadata’s health is displayed are:
- High level view showing the count of different resources used by Motadata.
- Core Process Statistics
- Message Queue Statistics
- Core Engine Statistics
- Monitor (Polling Issue)
Error Log: List of errors encountered by Motadata while monitoring your network. Please note that the issues here are on Motadata side and not your network side.
Data Store: List of information related to Motadata’s database storage.
Live Sessions: List of devices on which Motadata’s GUI component is currently active.
Motadata Component Versions: List of components and their versions that are used by your Motadata system.
2.1.2.1. Motadata
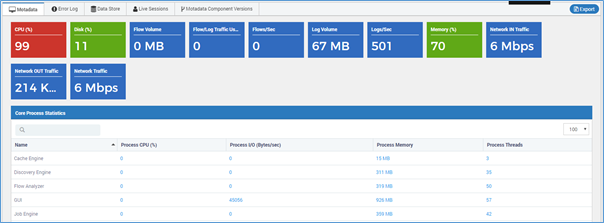
The widgets shows:
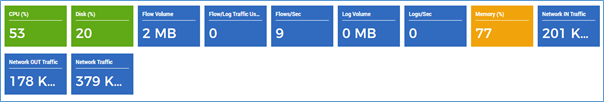
Master Tab Widgets
- CPU (%): The snippet shows live value for CPU utilization by Motadata. If you click on the snippet, you’ll see the data using drill down feature i.e. it shows the CPU (%) for specific date and time.
- Disk (%): The snippet shows live value for disk space utilization by Motadata. If you click on the snippet, you’ll see the data using drill down feature i.e. the Disk (%) for specific data and time.
- Memory (%): The snippet shows memory utilization by Motadata. This metric shows live values. If you click on the snippet, you’ll see the memory (%) for specific date and time.
- Network IN Traffic (BPS): Network IN Traffic (BPS) The snippet shows live network IN traffic i.e. Traffic entering Motadata. By clicking on it you’ll see the data for specific date and time.
- Network OUT Traffic (BPS): The snippet shows live network OUT traffic i.e. traffic exiting Motadata. If you click on the snippet, you’ll see the network OUT traffic for specific date and time.
- Flow Volume (MB): The snippet shows the amount of the flow volume received on present/current day in MB. If you click on the snippet, you’ll see the flow volume for specific date and time.
- Flow/Log Traffic Usage (%): The snippet shows flow/log traffic usage in Motadata. If you click on the snippet, you’ll see the flow/log traffic usage (%) for specific date and time.
- Flows/Sec: The snippet shows live value for amount of flow covered Motadata. If you click on the snippet, you’ll see the flow per second for specific date and time.
- Log Volume (MB): The snippet shows total log volume processed on present/current day in MB in Motadata. If you click on the snippet, you’ll see the log volume for specific date and time.
- Logs/Sec: The snippet shows live value of log processed by Motadata per second. If you click on the snippet, you’ll see the logs per second for specific date and time.
- Network Traffic (BPS): The snippet shows overall network interface utilization of Motadata. If you click on the snippet, you’ll see the network traffic for specific date and time.
Core Process Statistics Motadata has 9 core processes (excluding remote polling engine). This segment shows their statistics. This segment shows the CPU, process (I/O in bytes), and Memory and Process Threads used by each core process:
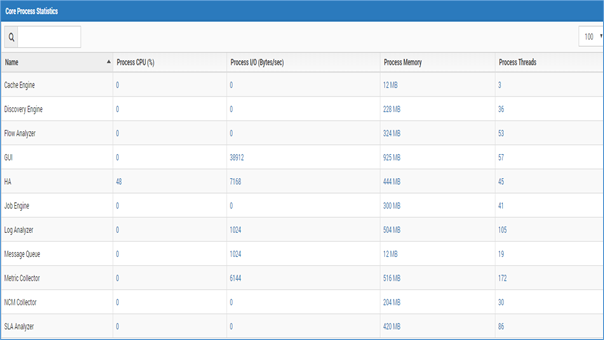
Core Process Statistics
Columns Description
- Process CPU (%): Displays current CPU utilization of the process in percentage.
- Process I/O (bytes/sec): Displays Input and Output of process in bytes per second. If you click on it, you’ll get complete context along with date and time.
- Process Memory (KB): Displays memory consumption by process. If you click on it, you’ll see the data for specific date and time.
- Process Threads: Displays the number of running threads by the process. If you click on it, you’ll see the data for specific date and time.
Message Queue Statistics When you enter any query in Motadata, this runs in queue. The query that gets completed comes under “Finished Messages”. The query that has just been generated comes under “In Flight Messages”. The query that is still in queue comes under “Pending Messages”. The query that could not be completed on time and has been re-queued comes under “Requeued Messages”.
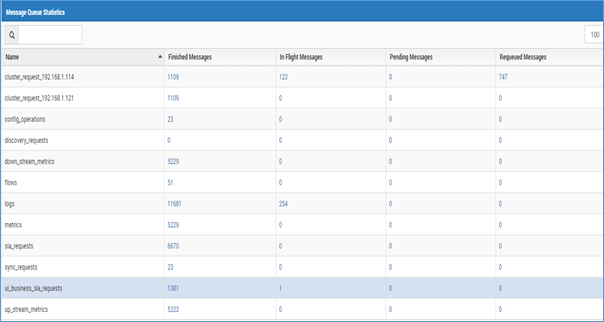
Message Queue Statistics
Core Engine Statistics This section shows the Memory (%), Threads, and Uptime of the core engines in Motadata. The list of core engine may vary from your actual screen. The list depends on your configuration of Motadata.
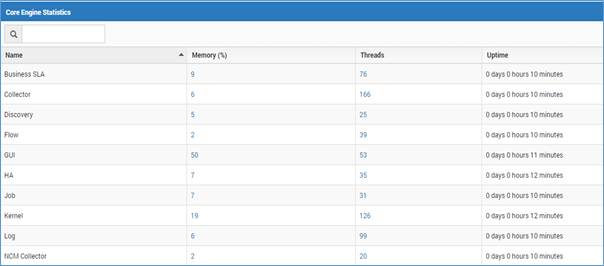
Core Engine Statistics
Columns Description
- Memory (%): This shows the memory utilization by the respective core engine. If you click on it, you’ll see the data for specific data and time.
- Threads: This shows the current number of threads running for the respective core engine. If you click on it, you’ll the data for specific date and time.
- Uptime: This shows the uptime of respective core engine post Motadata service restarts. When an engine’s uptime is “0 days 0 hours 00 minutes”, that means core engine is in down state.
Job Execution Status This section shows the current status of Motadata plugins. By default, the status of a plugin is ‘Available’ (Green color). When the plugin is being used, the status changes to ‘Running’ (Red color).
Job Name: Shows the name of the jobs available in your Motadata server.
Job status: Shows the status of the job. There are two status available:
- Running (Red color)
- Available (Green color)
More Info: Shows the additional information about the job. The information shows the details of the last job. When a new job is executed, the details are updated in the runtime.
- scheduler Name: Shows the name of scheduler that ran the job.
- Status: Shows the status of the scheduled job.
- Running (Red Color)
- Complete (Green Color)
- Execution Time: Shows the timestamp at which the job was executed.
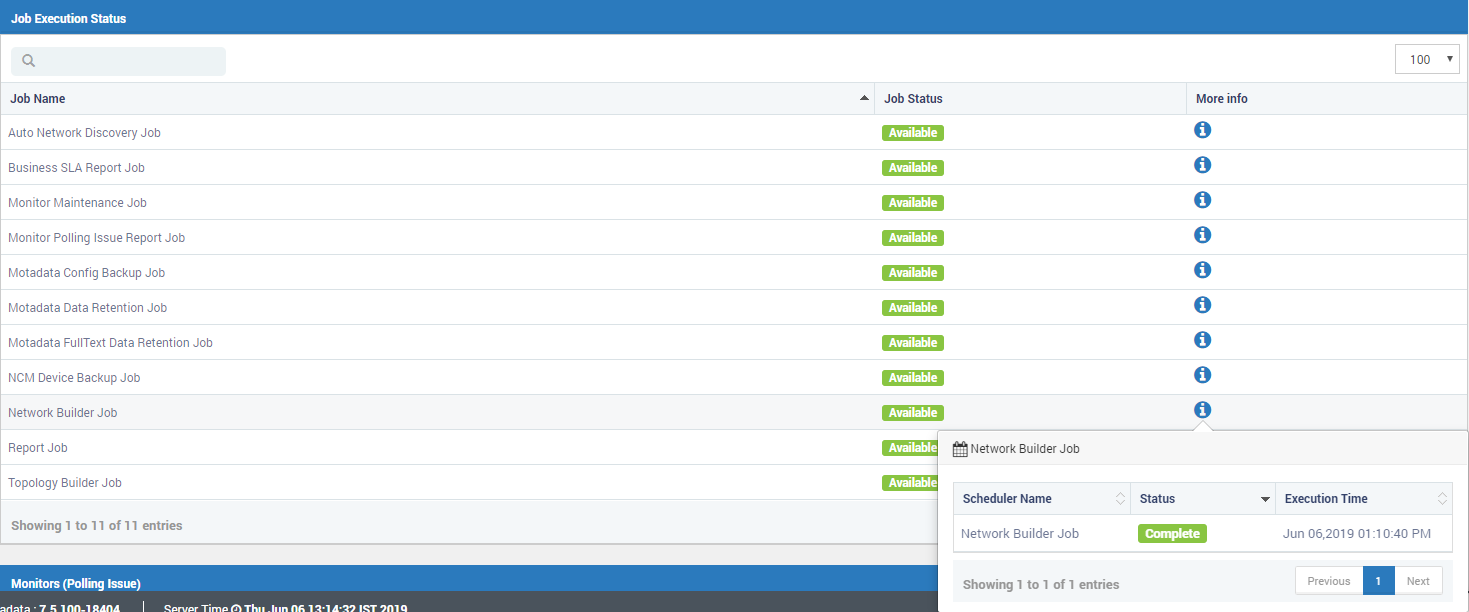
Job Execution Status
Monitors (Polling Issue) The monitors that cannot be reached by Motadata or where the ping failed are displayed in this segment. If you click on any of the listed monitors, you’ll see complete details about the unreachable monitor. Motadata sends an email when it fails to poll the monitor. Also, it sends another email when polling starts again.
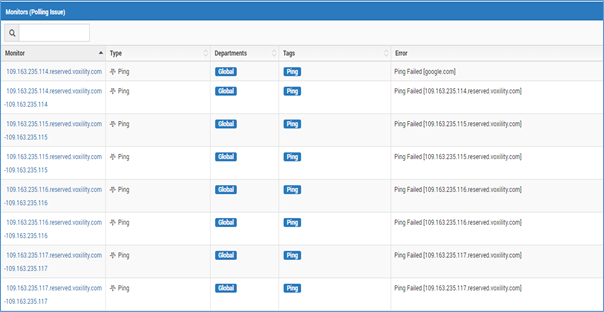
Monitors Polling Issue
This also shows the department of the unreachable monitor. There are three possible reasons for this:
- Ping Fail
- Device Unreachable
- Invalid Credentials
Column Description
- Tags: Shows the tags of monitor that have polling issue.
- Type: Shows the type of monitor that have polling issue.
- Error: Shows the error message about why Motadata could not poll the monitor.
Export The health statistics dumps the log files for kernel and workers in a zip file to local system of user. The worker logs are available when the respective worker is active in system.
| File Name | Description |
| Motadata.dump | Kernel Dump |
| Motadata-discovery.dump | Discovery Worker (Default Worker) |
| Motadata-metric.dump | Metric Worker (Default Worker) |
| Motadata-python-engine.dump | Python Engine (Default Worker) |
| Motadata-sla.dump | SLA Dump (Available when enabled) |
| Motadata-trap.dump | Trap Dump (Available when enabled) |
| Motadata-log.dump | Motadata Log (Available when enabled) |
| Motadata-flow.dump | Motadata Flow (Available when enabled) |
| Error Logs | Logs for debug, error, fatal error, info, invalid query, statistics, trace, warning, and agent info. |
| PDF Files | Health Statistics |
| Motadata-job.dump | Job Worker (Default Worker) |
2.1.2.2. Error Log
This segment shows all the errors logs incurred since last reboot. You may also export the error logs. To export the logs click on the Export button on bottom right corner. A zip file will download automatically.
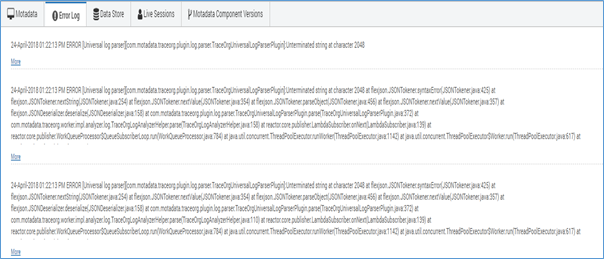
Error Log
2.1.2.3. Data Store
This segment shows complete statistics of Motadata’s database.
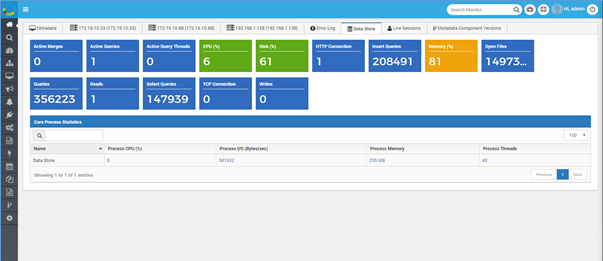
Data Store
Overview
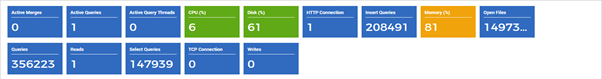
Overview of Data Storage
- Active Merges: This snippet shows live data i.e. number of active merges. The table created during flow visualization compresses after every new flow entry. This compression is also referred to as “Merge”.
- Active Queries: This shows total number of active queries. This snippet shows live data.
- Active Query Threads: This shows total number of threads running for query execution.
- CPU (%): This shows CPU utilization by Motadata Report Database. This snippet shows live data. The same statistics can be viewed under Motadata tab in Motadata Health.
- Disk (%): This shows disk utilization by Report Database. This snippet shows live data. The same statistics can be viewed under Motadata tab in Motadata Health.
- HTTP Connection: This shows total number of live HTTP connections with Report Database.
- Insert Queries: This snippet shows total number of queries inserted ever since Motadata has been installed.
- Memory (%): This shows memory utilization by Report Database. This snippet shows live data. The same statistics can be viewed under Motadata tab in Motadata Health.
- Open Files: This shows the total number of files opened since Motadata has been installed.
- Queries: This snippet shows the total number of queries processed by Motadata i.e. sum of insert queries and select queries. This snippet shows the overall data ever since Motadata has been installed.
- Reads: This snippet shows the total number of reads (includes slow reads and normal reads) Report Database. This snippet shows live data.
- Select Queries: This snippet shows total number of slow reads as the reads are of two type’s slow reads and normal reads; this snippet lists the slow reads ever since Motadata has been installed.
- TCP Connection: This snippet shows total number of live TCP connections with Motadata.
- Writes: This snippet shows total number of writes ever since Motadata has been installed.
Core Process Statistics The section shows the core process statistics used by the database.
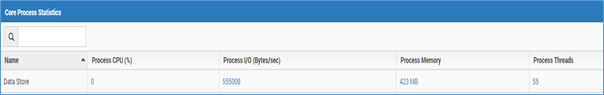
Core Process Statistics
- Core Process Name: Name of the core process.
- Process CPU (%): CPU utilization in percentage by the respective core process.
- Process I/O (bytes/sec): Shows the detailed process input and output data in bytes per second.
- Process Memory (KB): Shows the processed memory in KB.
- Process Threads: Shows current running threads of respective process.
2.1.2.4. Live Sessions
The section shows the details of the sessions that are currently active.
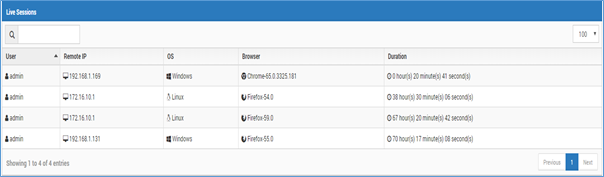
Live Sessions Page
Column Description
- User: It is the username of the person who has logged into Motadata.
- Remote IP: It is the IP address of the machine on which user has logged into Motadata.
- OS: It shows the operating system on which user has logged into Motadata.
- Browser: It shows the name and version of the browser on which user has logged into Motadata.
- Duration: It shows the duration of the active motadata session by the user.
2.1.2.5. Motadata Component Versions
The page shows the versions of all Motadata components. These are helpful to make sure that the plugins are compatible with your Motadata server.
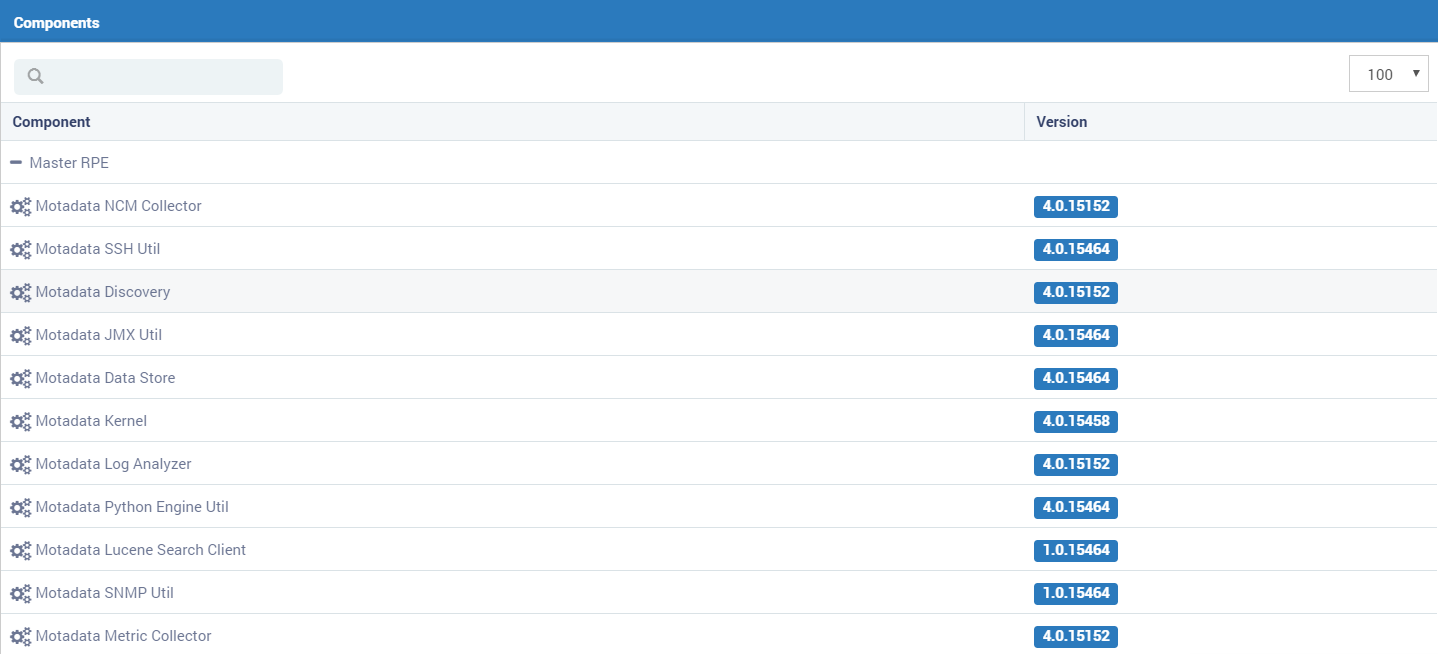
Motadata Component Version